



Markets contend with uncertainty, but fundamentals remain the key driver
Review the latest Weekly Headings by CIO Larry Adam.
Key takeaways:
- The bond market struggled after Warsh delivered little clarity on the rate outlook
- Despite a softer GDP print in Q2, underlying demand remains resilient
- AI-related concerns spark equity volatility, despite strong 2Q26 earnings results
The term “Dog Days of Summer” traces its roots to the Farmer’s Almanac, describing the 40-day stretch (traditionally July 3 through August 11) that typically marks the hottest and most humid weeks of the year. In financial markets, this period is often associated with lighter trading volumes, thinner liquidity and seasonal equity market weakness, conditions that can amplify volatility.
Yet this summer has offered little opportunity for a lull. Investors have contended with Federal Reserve (Fed) policy uncertainty, renewed tariff-driven inflation concerns, escalating tensions in the Middle East, questions about the durability of AI-related investment spending and a packed earnings calendar. While these developments may sway short-term sentiment, fundamentals remain the primary driver of long-term returns and the economic outlook.
This week, we highlight five key themes shaping the economy and market landscape.
Markets struggle with Warsh’s messaging
Fed Chair Warsh’s push to end forward guidance injected unusual uncertainty into this Federal Open Market Committee meeting. While markets broadly expected another hawkish hold, the odds of a surprise rate hike remained meaningful at approximately 30%. Ultimately, the committee left the federal funds rate unchanged at 3.50%-3.75%, made no material changes to its streamlined statement and saw three regional Fed presidents –Logan, Hammack, and Kashkari – dissent in favor of a 25 basis point hike.
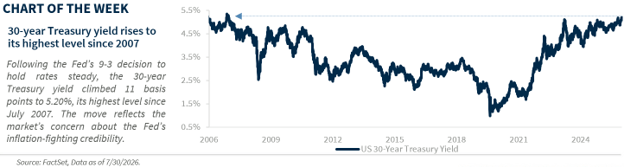
Despite inflation remaining above the Fed’s 2% target, Warsh offered little rationale for holding rates steady, even as he reiterated that “we will deliver price stability... this Fed will not waver.” The lack of clear policy signals unsettled markets, pushing the 30-year Treasury yield above 5.20%, its highest level since 2007. While Warsh remains focused on price stability, investors are seeking more policy clarity. Even so, we expect the Fed to stay on hold this year.
GDP data is stale; growth remains resilient
The US economy grew at a 1.5% annualized pace in the second quarter, down from 2.1% in 1Q. However, the backward-looking GDP report likely understates current momentum, as it largely reflects activity dating back to Easter and misses spending tied to the Fourth of July and World Cup.
Growth was also weighed down by temporary drags, including a surge in imports and slower government spending. More recent data point to continued resilience: Jobless claims remained below 200,000 for a second straight week, while Visa and Mastercard reported healthy consumer spending at the start of 3Q, consistent with other real-time indicators such as Redbook sales and restaurant bookings. Meanwhile, durable goods orders and hyperscaler results suggest corporate investment remains robust. Taken together, the latest data reinforce our view that growth will accelerate and remain above potential this year.
Earnings story remains intact
Equities have defied the typical July seasonal pattern, with the S&P 500 on track for its first July decline since 2014. Surging oil prices drove interest rates higher, while concerns over the sustainability of AI-related capital spending weighed on sentiment, sending the NASDAQ 100 more than 10% below its recent peak and into correction territory. However, with this week marking the busiest stretch of the 2Q26 earnings season, results from several mega-cap technology companies have helped ease those concerns.
Thus far, hyperscalers have reaffirmed capex plans, signaling that demand for cloud and AI services continues to exceed available capacity and supporting ongoing investment. The positive read-through has also extended to industrial “picks and shovels” providers tied to data center buildouts, with several reporting strong earnings beats and raising guidance.
More broadly, 2Q26 results continue to underscore strong corporate fundamentals, with S&P 500 earnings on pace to grow 37% year over year, or a still-impressive 25% excluding private security revaluations. Strong earnings growth remains a key pillar supporting our constructive 12-month 8,200 S&P 500 target.
Tariffs return
Last week, the White House finalized its Section 301 tariffs, replacing the expiring 10% Section 122 tariffs. The new framework imposes tariffs of either 10% (EU, India) or 12.5% (China, Japan) on major trading partners, citing their failure to ban goods made with forced labor.
The tariffs are already facing legal challenges, suggesting the path forward may remain uncertain. In the meantime, we estimate the weighted average tariff rate has risen from 8% to 10%. While that represents a small increase, it remains well below last year’s approximately 20% peak, which should help inflation continue to moderate on a year-over-year basis while limiting the impact on economic growth.
Middle East conflict continues
Equity markets have largely shrugged off a conflict now entering its sixth month, but the on-again, off-again nature of military action continues to drive volatility in oil prices. With the national average gasoline price back above $4.00 per gallon and higher energy costs working their way through supply chains, inflation pressures could remain elevated, adding to broader voter affordability concerns.
As the midterm elections draw closer, those concerns may increasingly shape the White House’s approach to the conflict. With Labor Day traditionally marking the start of the final sprint to Election Day, and most voters historically making up their minds by then, the window for fuel prices to ease is narrowing. Our base case remains that a durable off-ramp to the conflict emerges by mid-August; if not, we may need to revisit and raise our ~$70 per barrel year-end oil forecast.
All expressions of opinion reflect the judgment of the author(s) and the Investment Strategy Committee and are subject to change. This information should not be construed as a recommendation. The foregoing content is subject to change at any time without notice. Content provided herein is for informational purposes only. There is no guarantee that these statements, opinions or forecasts provided herein will prove to be correct. Past performance is not a guarantee of future results. Indices and peer groups are not available for direct investment. Any investor who attempts to mimic the performance of an index or peer group would incur fees and expenses that would reduce returns. No investment strategy can guarantee success.
Economic and market conditions are subject to change. Investing involves risks including the possible loss of capital.
The information has been obtained from sources considered to be reliable, but we do not guarantee that the foregoing material is accurate or complete. Diversification and asset allocation do not ensure a profit or protect against a loss.
The S&P 500 Total Return Index: The index is widely regarded as the best single gauge of large-cap U.S. equities. There is over USD 7.8 trillion benchmarked to the index, with index assets comprising approximately USD 2.2 trillion of this total. The index includes 500 leading companies and captures approximately 80% coverage of available market capitalization.
Sector investments are companies focused on a specific economic sector and are presented here for illustrative purposes only. Sectors, including technology, are subject to varying levels of competition, economic sensitivity, and political and regulatory risks. Investing in any individual sector involves limited diversification.